
.avif)

Ready or not, Q4 is upon us. It’s important to plan for the upcoming quarter so that you and your team are clear on your goals and objectives. Coming up with a business strategy and a process to implement it helps keep the team accountable, aligned, and on track throughout the entire quarter. Having a plan in place each quarter allows you to continue to push your annual plan forward and take actionable steps towards those results. Planning for Q4 is especially important because it’s your last-ditch effort to end the calendar year strong.
We understand the importance of key performance indicators (KPIs) and objectives, but we also know that it can be stressful. Coming up with a quarterly plan should be your main focus, you shouldn’t have to worry about how to configure and lay out that content in a presentation, too. Let us handle the heavy lifting and provide the foundation of the presentation and slides so you can easily plug in your information and structure your story.
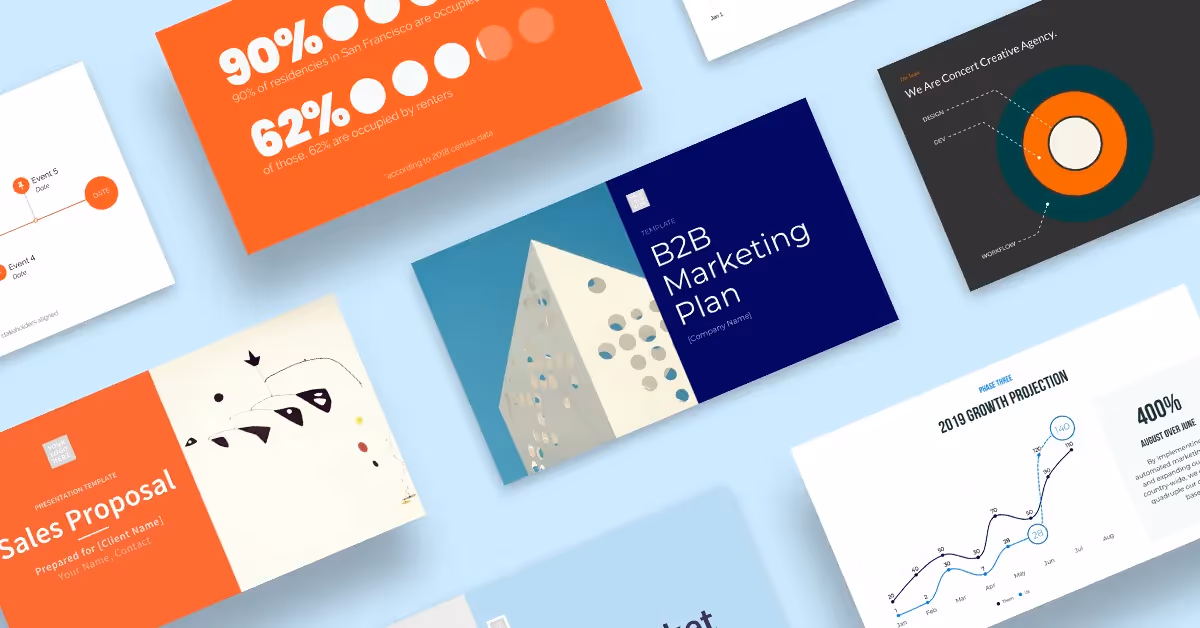
These are the 10 templates you need to help make your Q4 planning a breeze.
Year End Review
When the year comes to an end, it’s time to reflect on what worked for your business and what didn’t. A year-end review presentation can help you find solutions for any issues, and implement a strategy for company growth moving forward. Your end of year review presentation is a vital tool for presenting your findings to investors, upper management, or employees during all-hands meetings. In Q4 you’ll want to start thinking about a year end review, and how you’ll package it to the team— our template can help.
B2B Marketing Plan
If you don’t have a B2B marketing plan to outline your buyer persona, budget, promotions and advertising, and other strategies, your efforts won’t be as effective. Take the time to put together a Q4 B2B marketing plan that gives your campaigns context, examines your resources, analyzes your current marketing performance, and sets up a strategy to achieve your goals. This will help your quarter run more smoothly, with a more favorable outcome.
Go to Market Strategy
If you plan to launch a new product or service in Q4, you’ll want a go to market strategy. A go to market strategy, or GTM strategy, explains the process needed to break into a new market or a new audience, step by step. You can use a go to market strategy for a new product launch, new service offering, a startup launch, or a brand relaunch. It’s similar to a marketing plan, but with a narrower, more detailed focus on one of your products or services. A go to market strategy presentation ensures that your new product or service launch is properly planned out.
Sales Proposal
Sale proposals are used to demonstrate how your business, brand, service or product will positively influence a buyer, partner company, or investor. For a sales proposal to be successful it must include a straightforward message, be visually impactful, and show specific stats or data that reference your company’s strengths. A sales proposal streamlines the process and actionable steps to reaching your sales goals. Using a sales proposal in your Q4 planning ensures the entire team is up to speed and on the same page with the information being presented to prospective clients.
Budget Proposal
It’s not enough to come up with a list of goals or brainstorm a list of ideas for your business each quarter. You have to map out how you’ll accomplish those goals or make your ideas come to life… within a reasonable budget. When you need to make your case to managers or executives for additional resources in Q4, a budget proposal presentation is an essential tool. Your presentation should explain your idea, what obstacles you may come across in the coming months, and why your desired budget is necessary for the upcoming quarter.
Gantt Chart
A Gantt chart is a visual view of tasks scheduled over time. It's a type of bar chart that shows the start and finish dates of several elements of a project that include: what the project tasks are, who is working on each task, how long each task will take, and how tasks group together, overlap, and link with each other. When preparing new projects for Q4, a Gantt chart can help your team get organized and ensure deadlines are met.

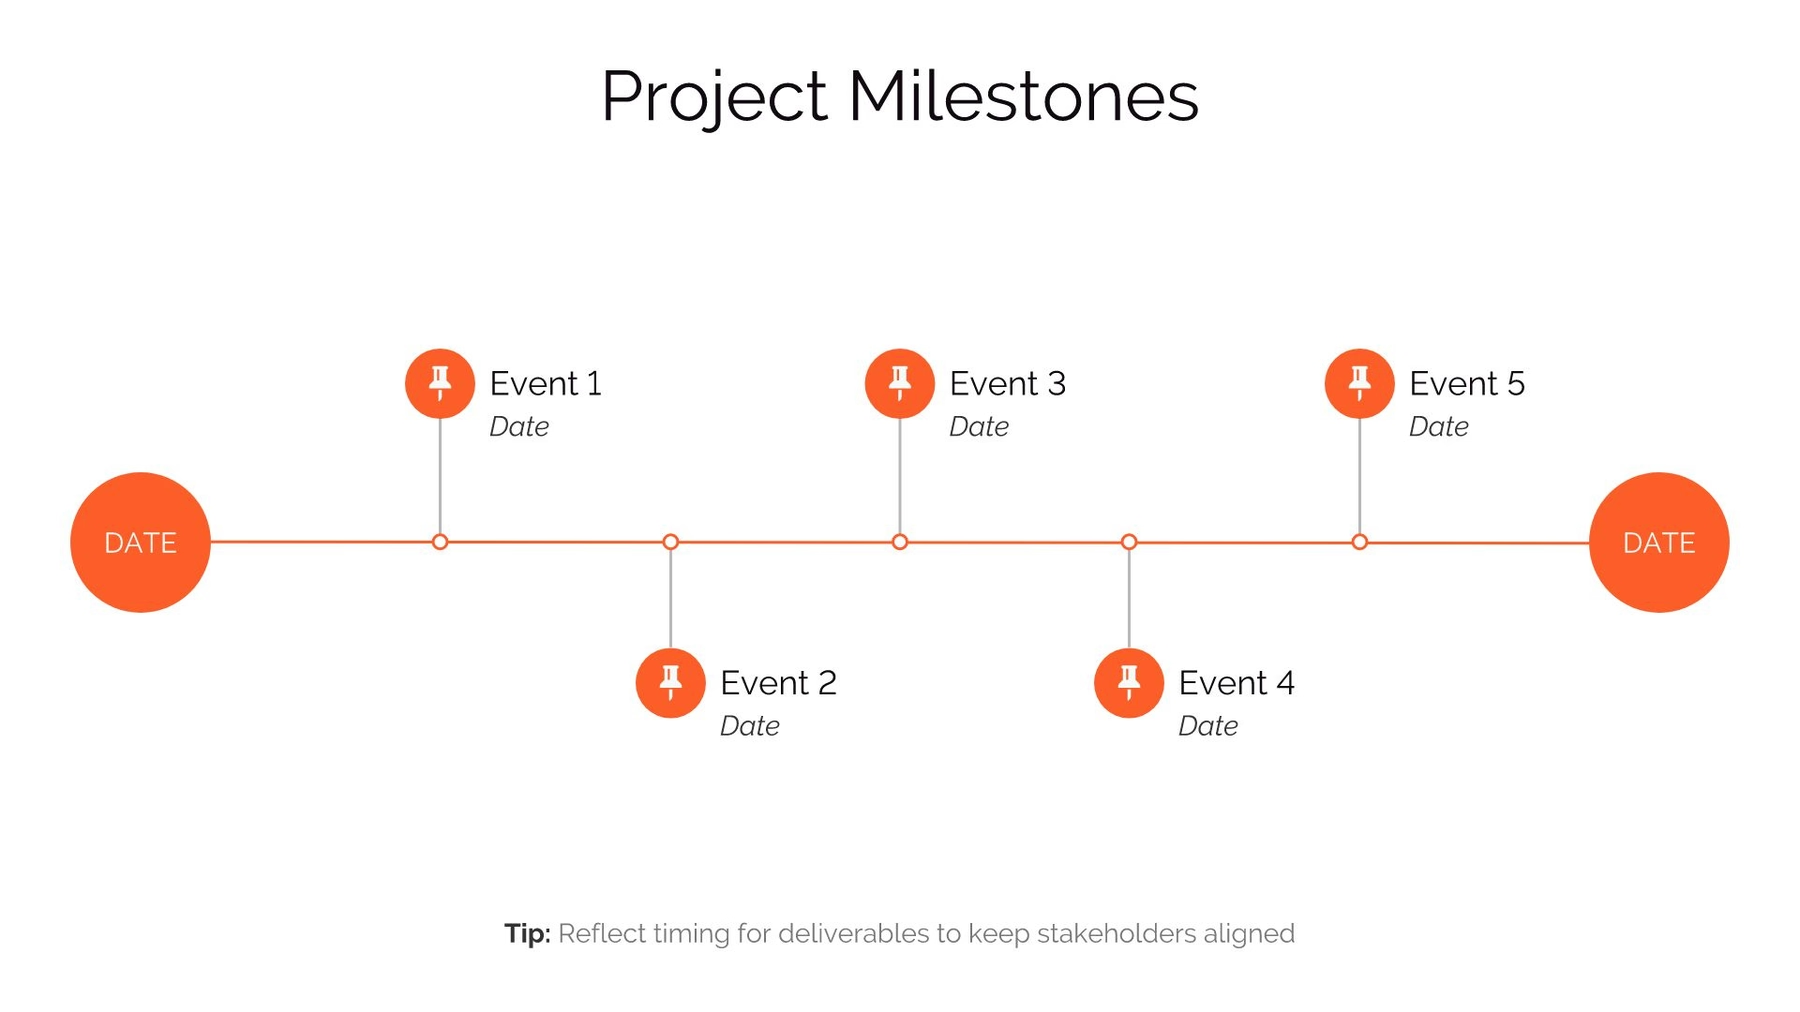
Timeline Chart
A timeline is a visual representation marking all major events over a period of time. Timeline slides have many versatile uses—everything from project plans, to status updates, to “next steps” can be communicated using a timeline. Timeline slides can help us to conceptualize the entire quarter at a glance. It’s a great chart to use to show that a Q4 plan or a process has been thoroughly vetted and is well-articulated.
Target Slide
A target is composed of a bullseye at the center, surrounded by concentric circles. Because of its format, a target slide can be used to show how a main idea (positioned in the center) branches off into related ideas or topics (in the surrounding circular areas). A target presentation template can also be broken into sections to display the steps in a process, with the goal as the bullseye. A target slide is a great way to show Q4 goals, and the steps necessary to achieve them. You may also choose a target slide to show the process in a new Q4 project.

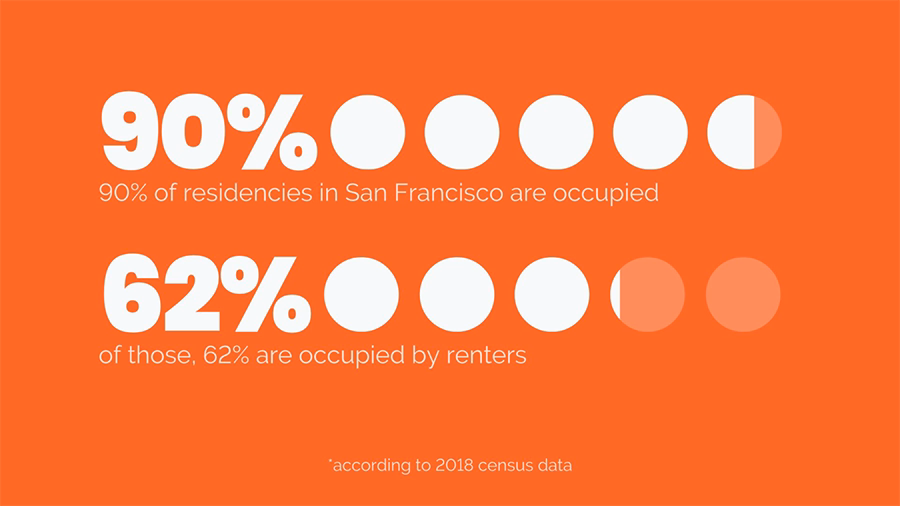
Pictograph
A pictograph template uses repeating rows or a grid of icons to represent data. A pictograph can be used in your Q4 planning to reflect on data and results from the previous quarter, or to share projected growth from new Q4 efforts. It is a more compelling, and visually appealing, way to share numbers with your team so it is easier for them to digest.
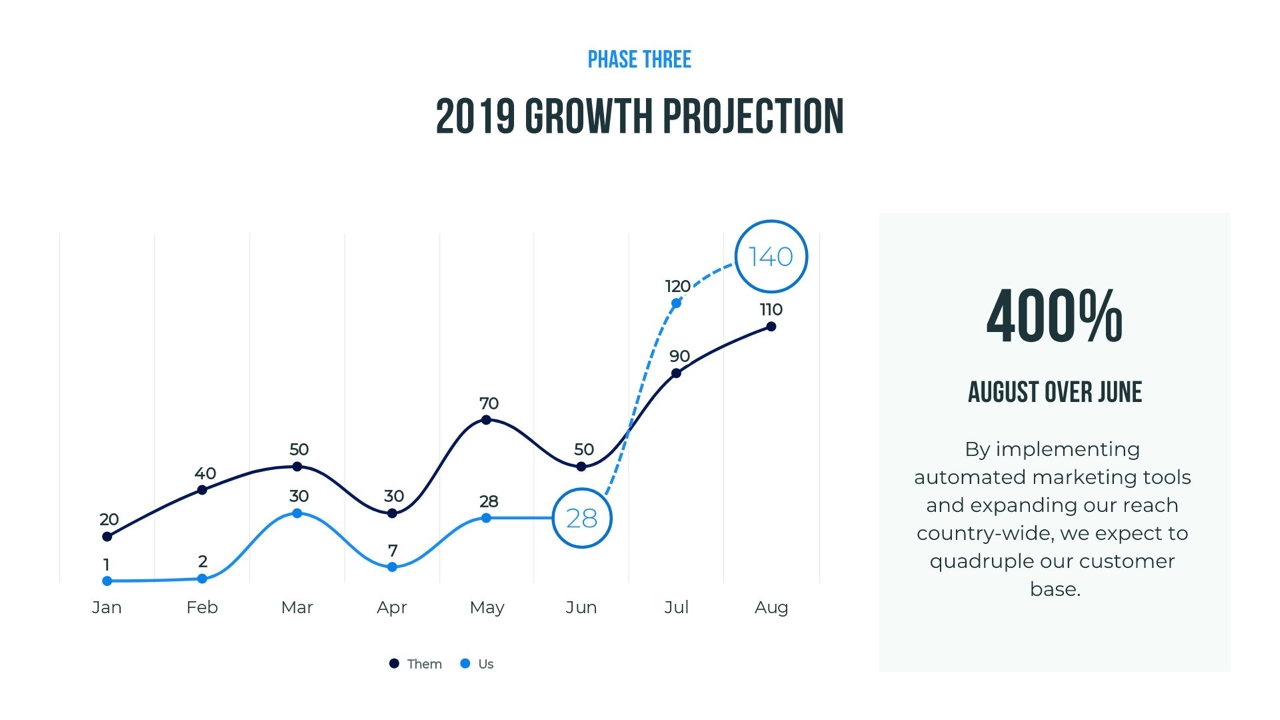
Line Chart
A line chart is a concise, visual way to show trends over time. The vertical y axis on a line chart (also called a line graph) is usually the amount of something, such as dollars, number of sales, or number of customers. The horizontal x-axis typically uses time as a measurement. It could be years, months, weeks, days, or even hours. A line chart is a good way to show data from the previous quarter, or how things are expected to trend in Q4. You can display things like how many conversions a marketing campaign received over a year, how many sales occurred in the last quarter, and how social media engagement performed in the last few weeks.


.gif)
.gif)

.gif)
