
.avif)
.avif)

As a presentation tool made by designers but geared towards everyone, Beautiful.ai comes fully loaded with dozens of essential presentation creation features. However, if we had to pick one thing that sets us apart from the competition it would be our Smart Slide templates.
Each template is carefully curated, and totally customizable, to help users craft professional slides regardless of their design skills. Our powerful Smart Slides technology can be used to quickly edit slides by automatically adapting when content is added or removed— resizing elements and adjusting the layout, all while maintaining corporate brand guidelines. Simply put, it takes on the tedious task of design and allows you to reclaim valuable time for other meaningful work.
With over 60 Smart Slide templates to choose from, there’s something for everyone. We have a hard time playing favorites with our slides, so we took it to the polls and asked our power-users which slides they love and use the most.
The results are in. These are our customers’ top 10 favorite Smart Slides, ranked. Do you see your go-to slide template on the list?
1. Photo Grid
Our customers love the photo grid template for its versatility, and it was the stand-out winner for favorite slide.
A photo grid slide template can help your presentation tell a story visually without having to rely solely on text. This slide can be used to present big information in a bolder way, mix media with text, or showcase a series of visuals.

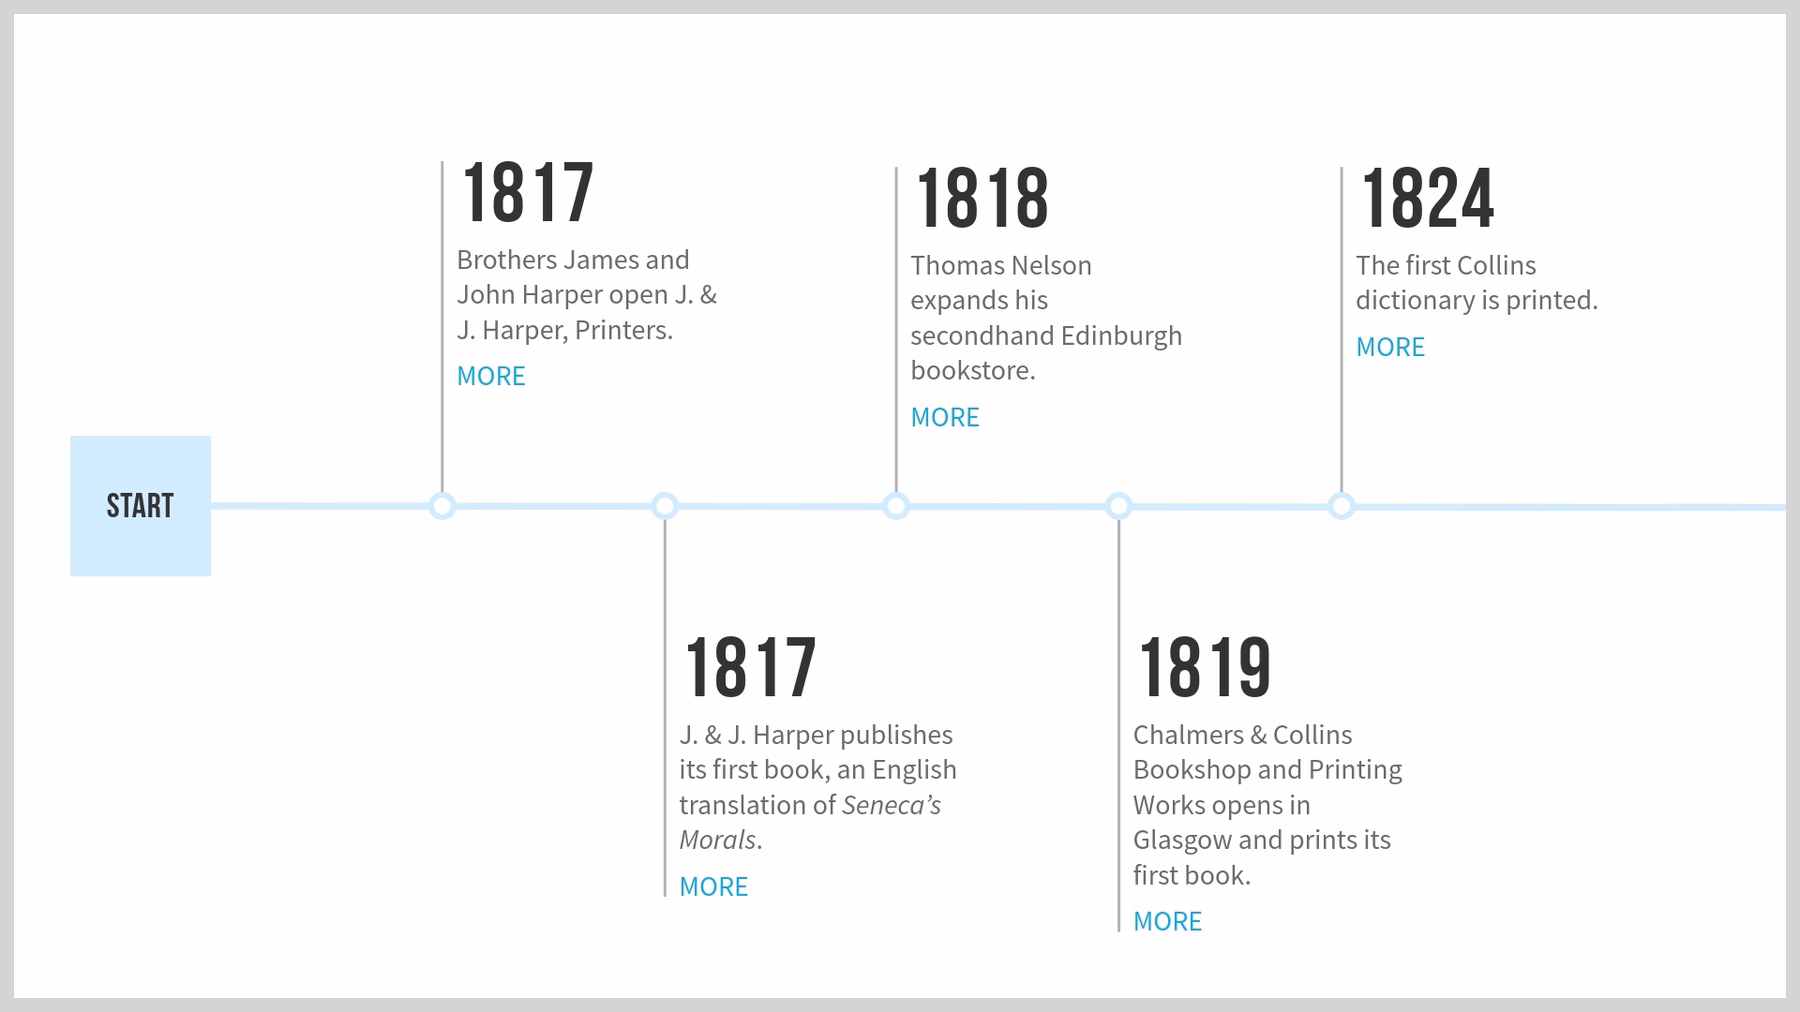
2. Timeline
A timeline slide is a visual representation marking all major events over a period of time. Timeline slides have many use cases which makes it a crowd favorite. This template can be used for everything from project plans, to status updates, to presenting historical data in a more visual way.
3. Journey
Customer journey maps give insight into how your customers interact with your brand throughout the sales process. They show what actions your users take before, during, and after conversion, often with the help of timeline-esque visuals. The customer journey Smart Slide can also help presenters visualize customer behavior, understand a sales process, identify barriers to conversion, or showcase a campaign journey in a non-linear way.

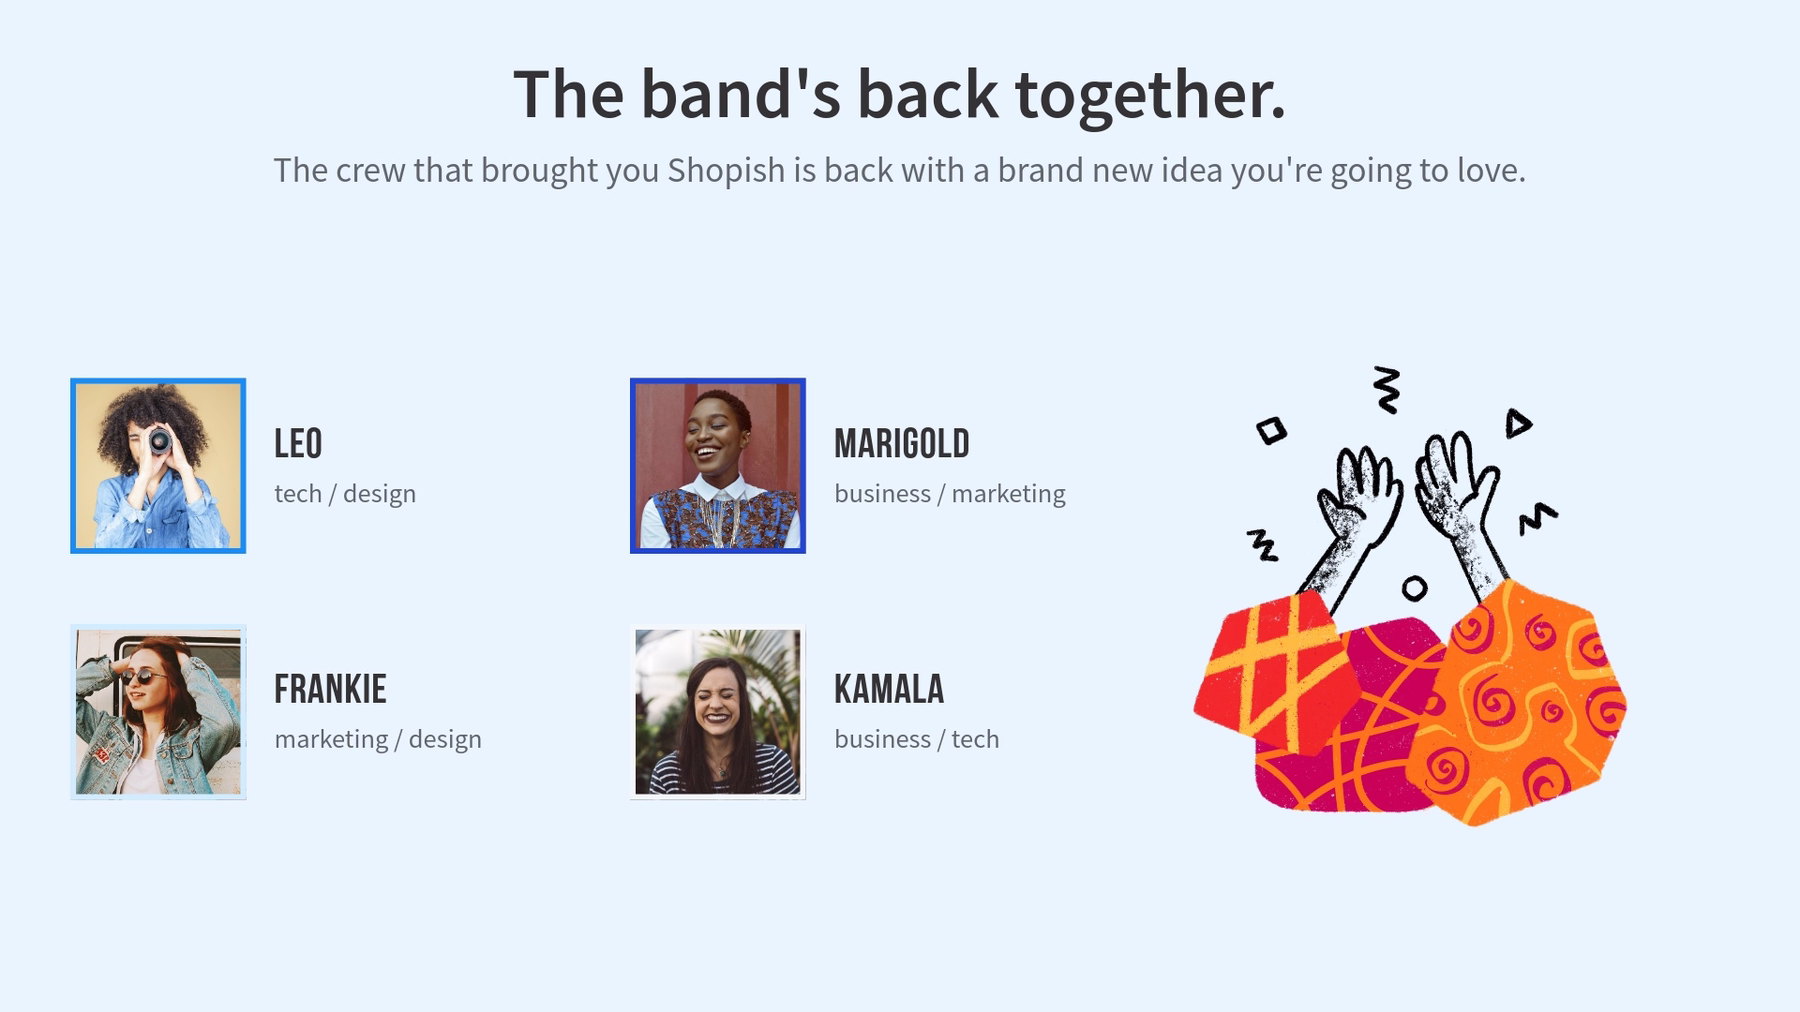
4. Team
A team slide is a visual depiction of the members of your team. It should have photos, names, job titles, and can even include short bios or credentials. You can use team slides in a variety of presentations, including: introducing investors to your leadership team, onboarding new employees, or showcasing your team's expertise to prospects.
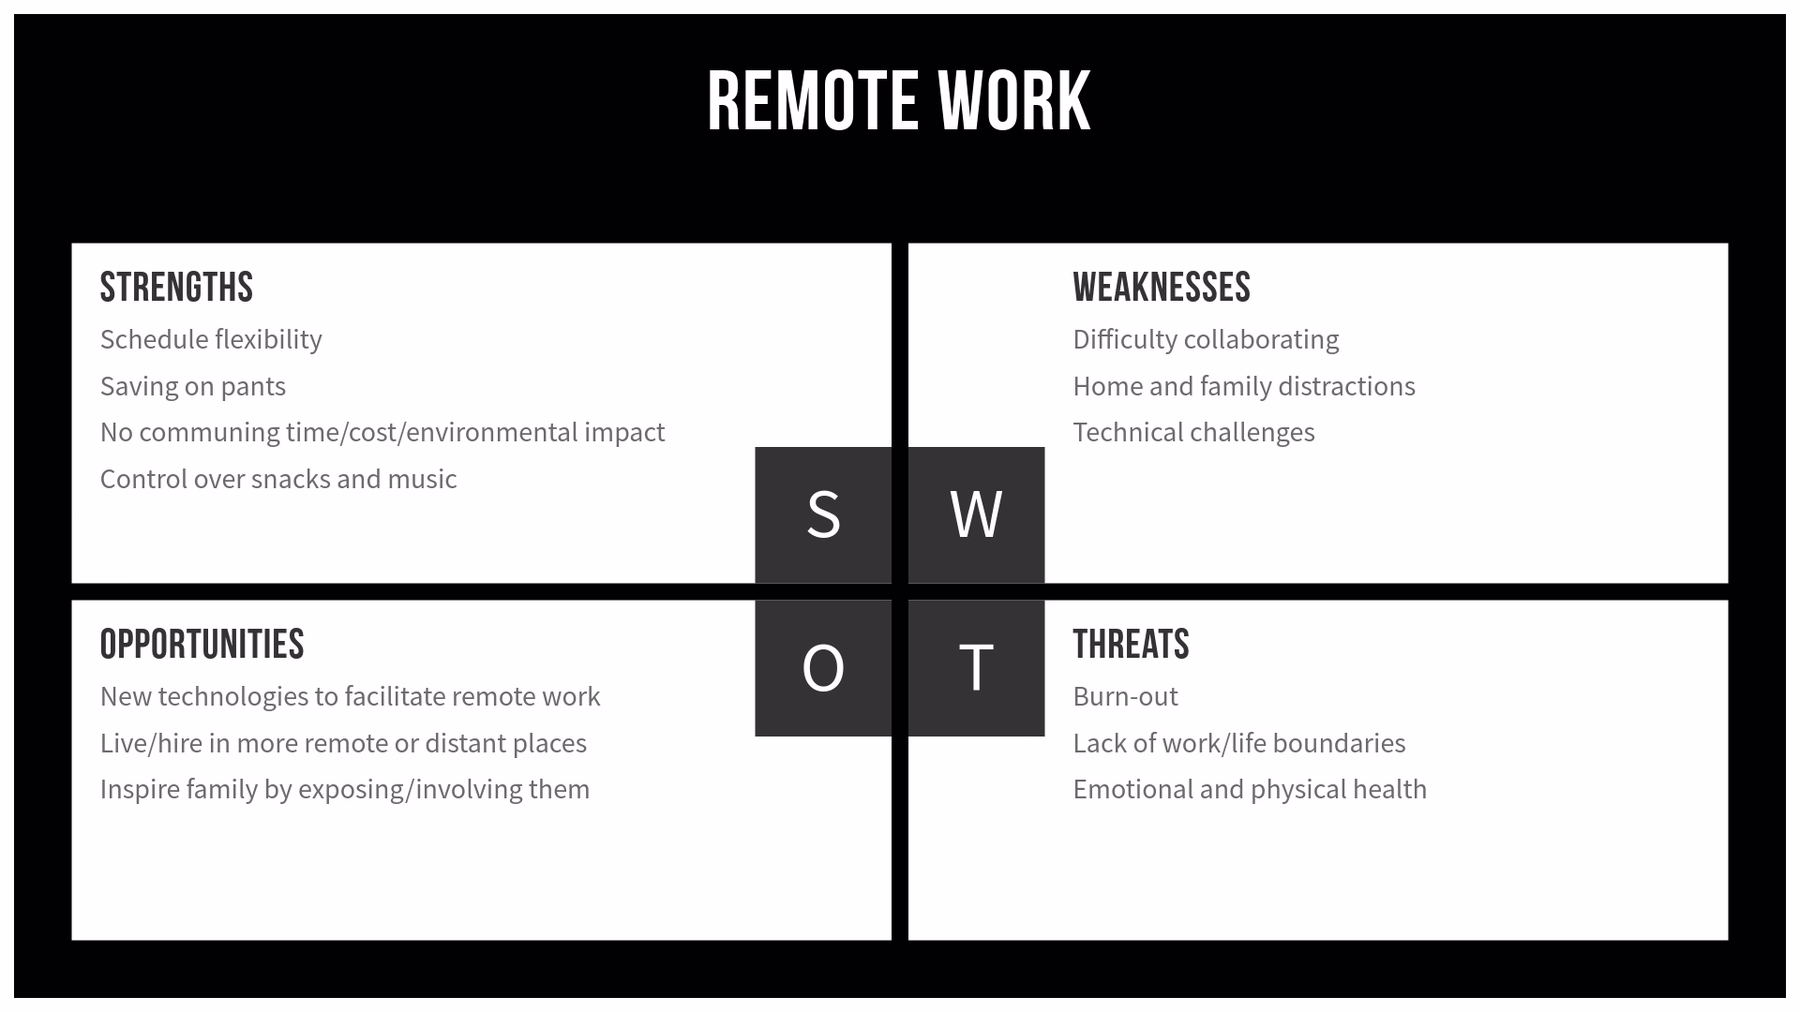
5. SWOT
Beautiful.ai’s SWOT analysis Smart Slide is both a classic and crowd favorite. SWOT is an evaluation model used to help identify strengths, weaknesses, opportunities, and threats to a business, project, or opportunity. A SWOT analysis template simplifies the process of designing your own SWOT matrix for a presentation so you can focus on the content versus design.
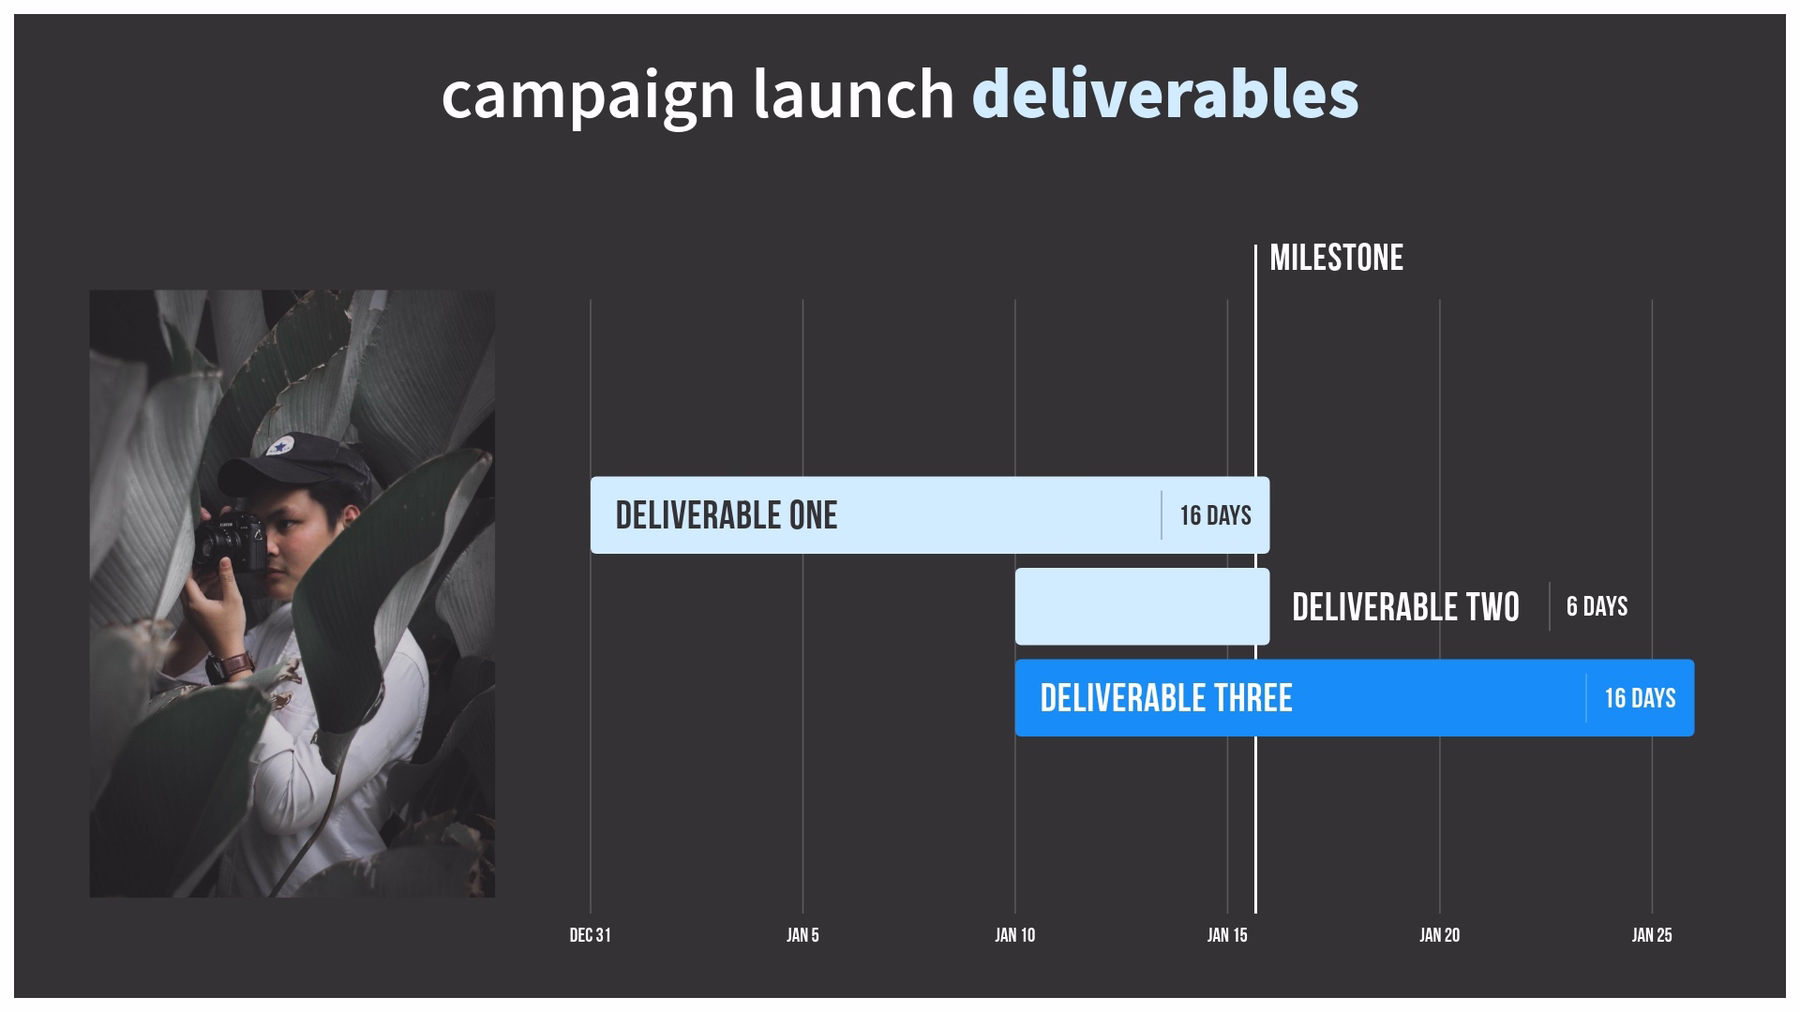
6. Gantt Chart
A Gantt chart is a visual view of tasks scheduled over time. A relative of the bar chart, Gantt shows the start and finish dates of several elements of a project that include: what the project tasks are, who is working on each task, how long each task will take, and how tasks group together, overlap, and link with each other.
Our customers are using Gantt for planning, project management to track tasks and milestones, and product roadmaps to manage deadlines and deliverables.
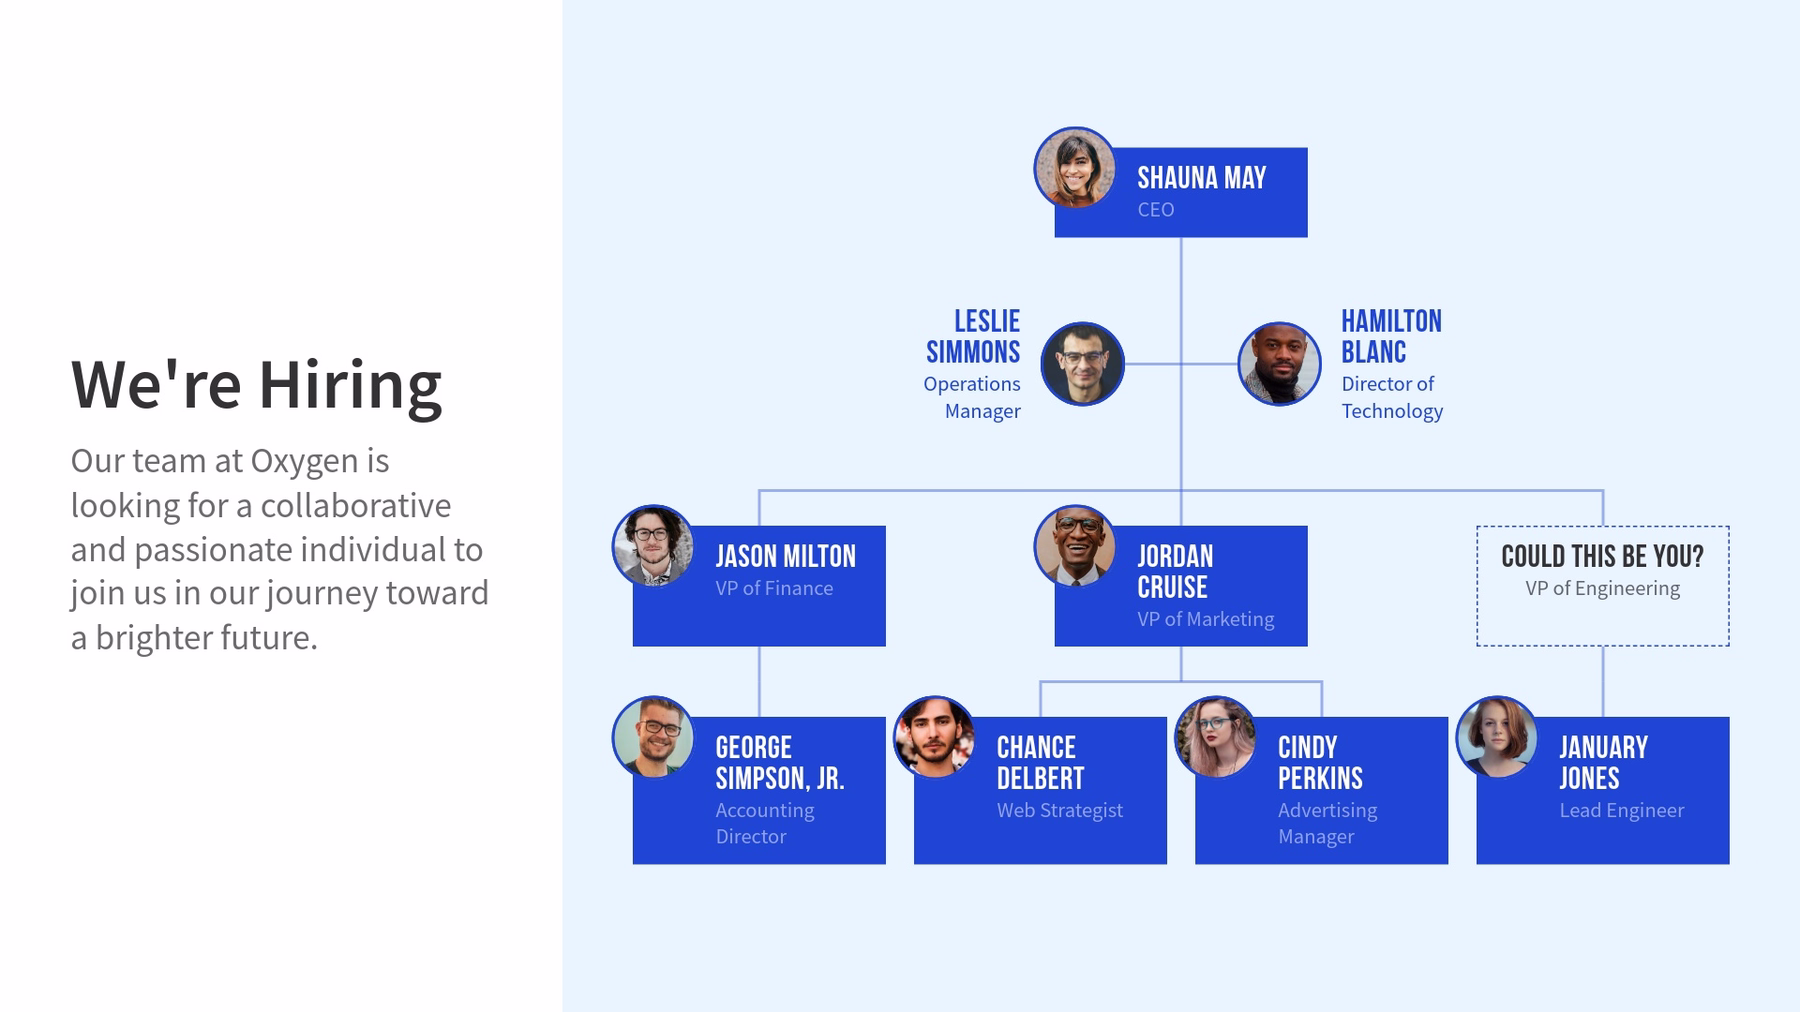
7. Org Chart
An org chart, or an organizational chart, is a diagram that illustrates the structure and reporting relationships within a company. Org charts are great tools for displaying how work flows within the company. You might use our org chart slide template to help people understand company structure, keep track of changing roles or employees, or share employee contact information company-wide.
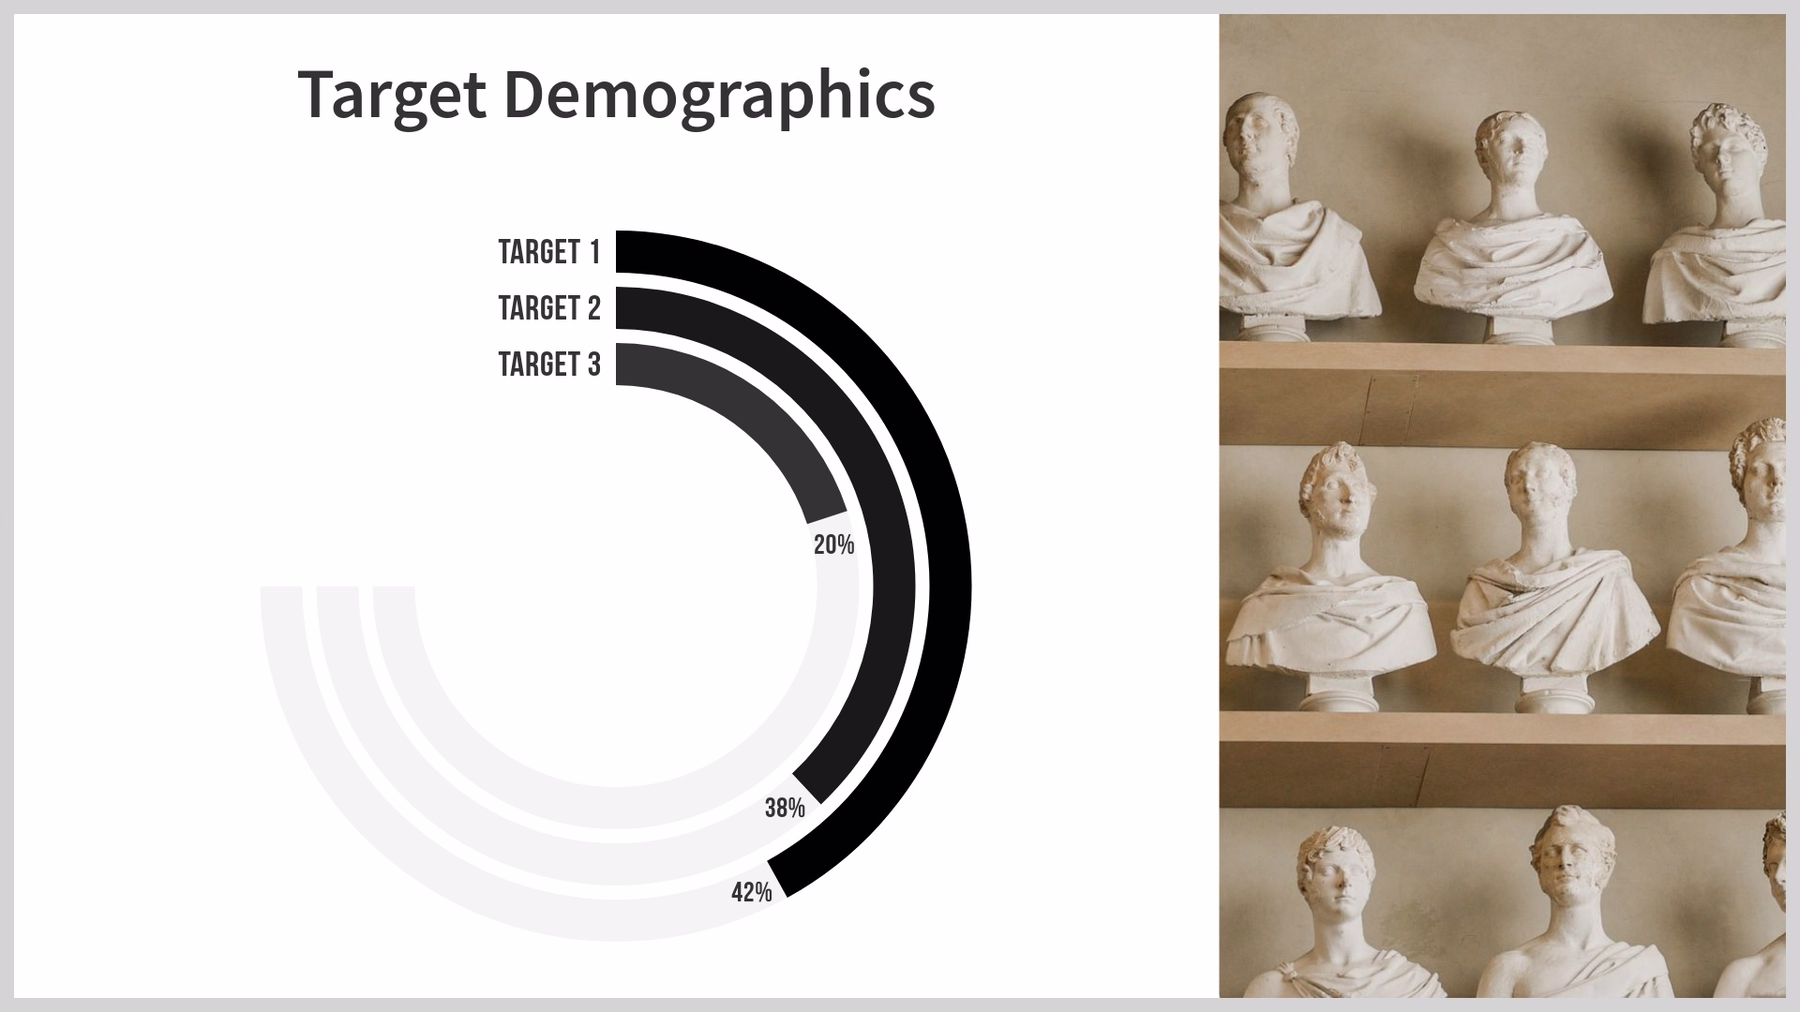
8. Radial Bar
Need to add a little visual interest to your business presentation? A radial bar graph slide can display your data easily and effectively. The radial bar graph is a good option if you’re looking to mix things up from a traditional vertical or horizontal bar. Customize our radial bar graph template to compare data over time, show relationships between two different groups, or call out patterns or trends in data.
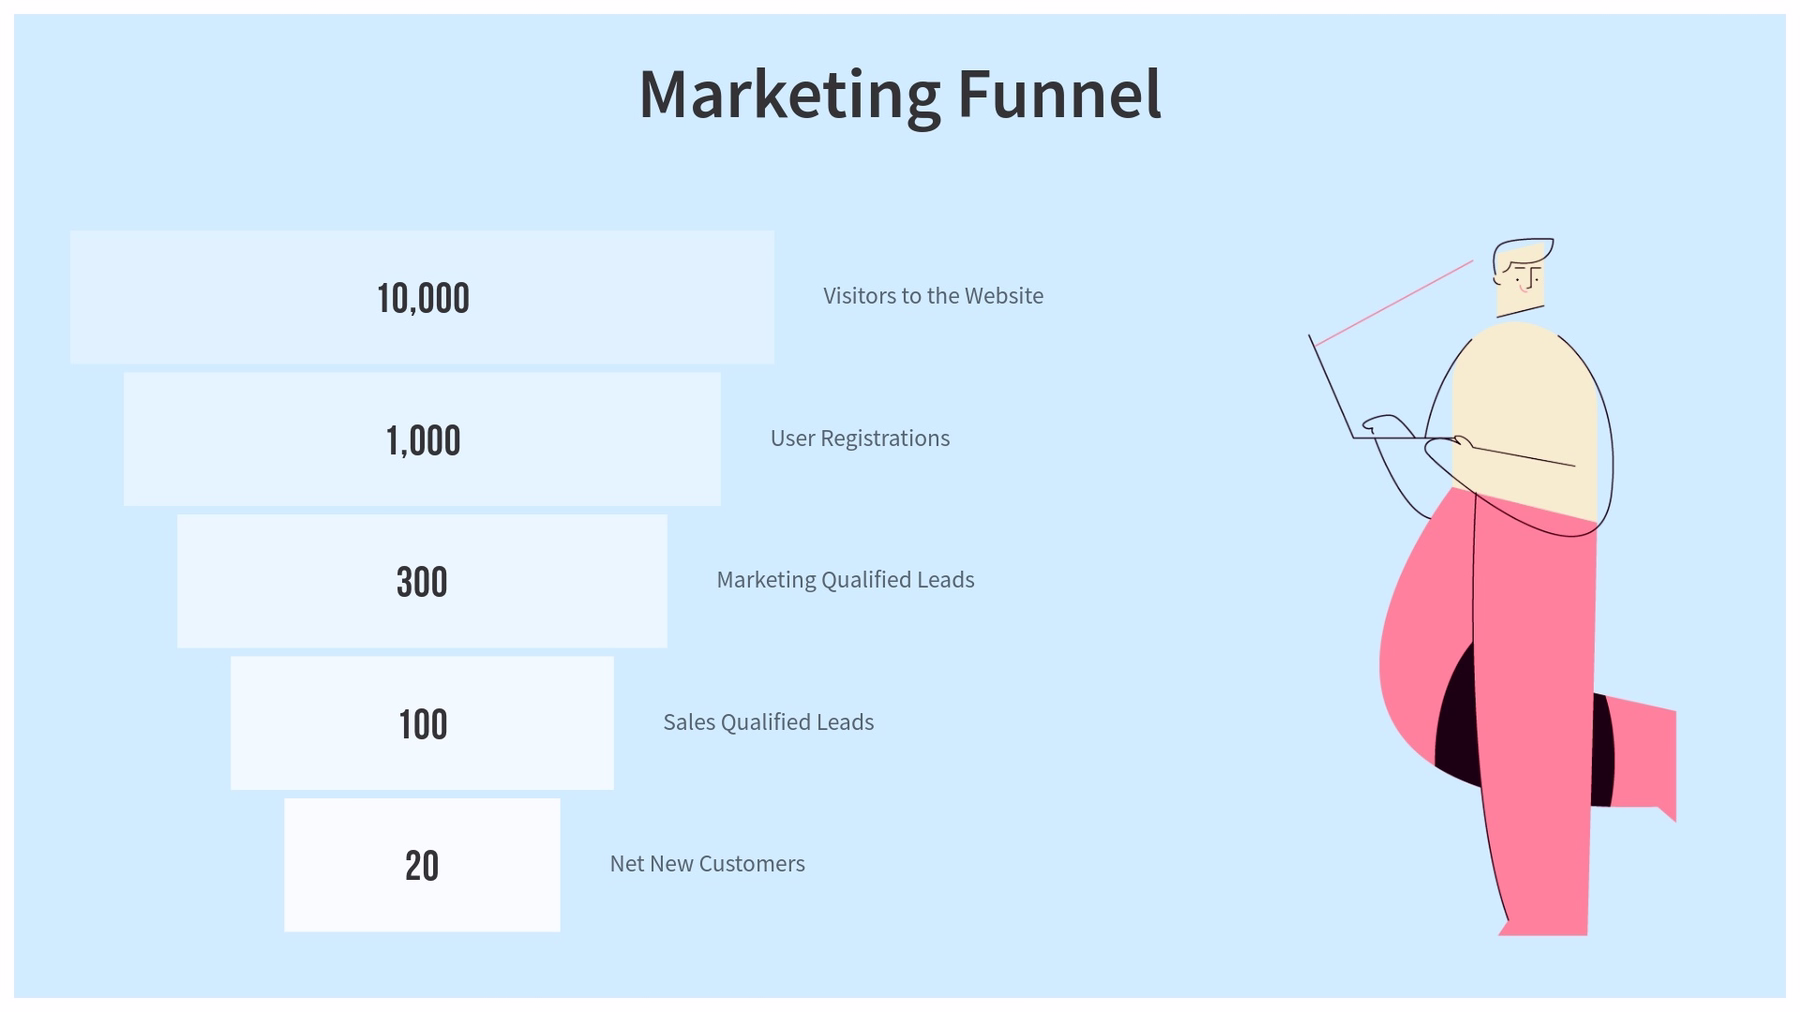
9. Funnel
A funnel chart is an incredibly versatile diagram that illustrates the stages of a process in the workplace. People often use funnel slides in presentations to summarize data, track sales conversion and retention rates, or identify where a process breaks down. It’s a great chart for sales and marketing teams, but the use cases are endless.
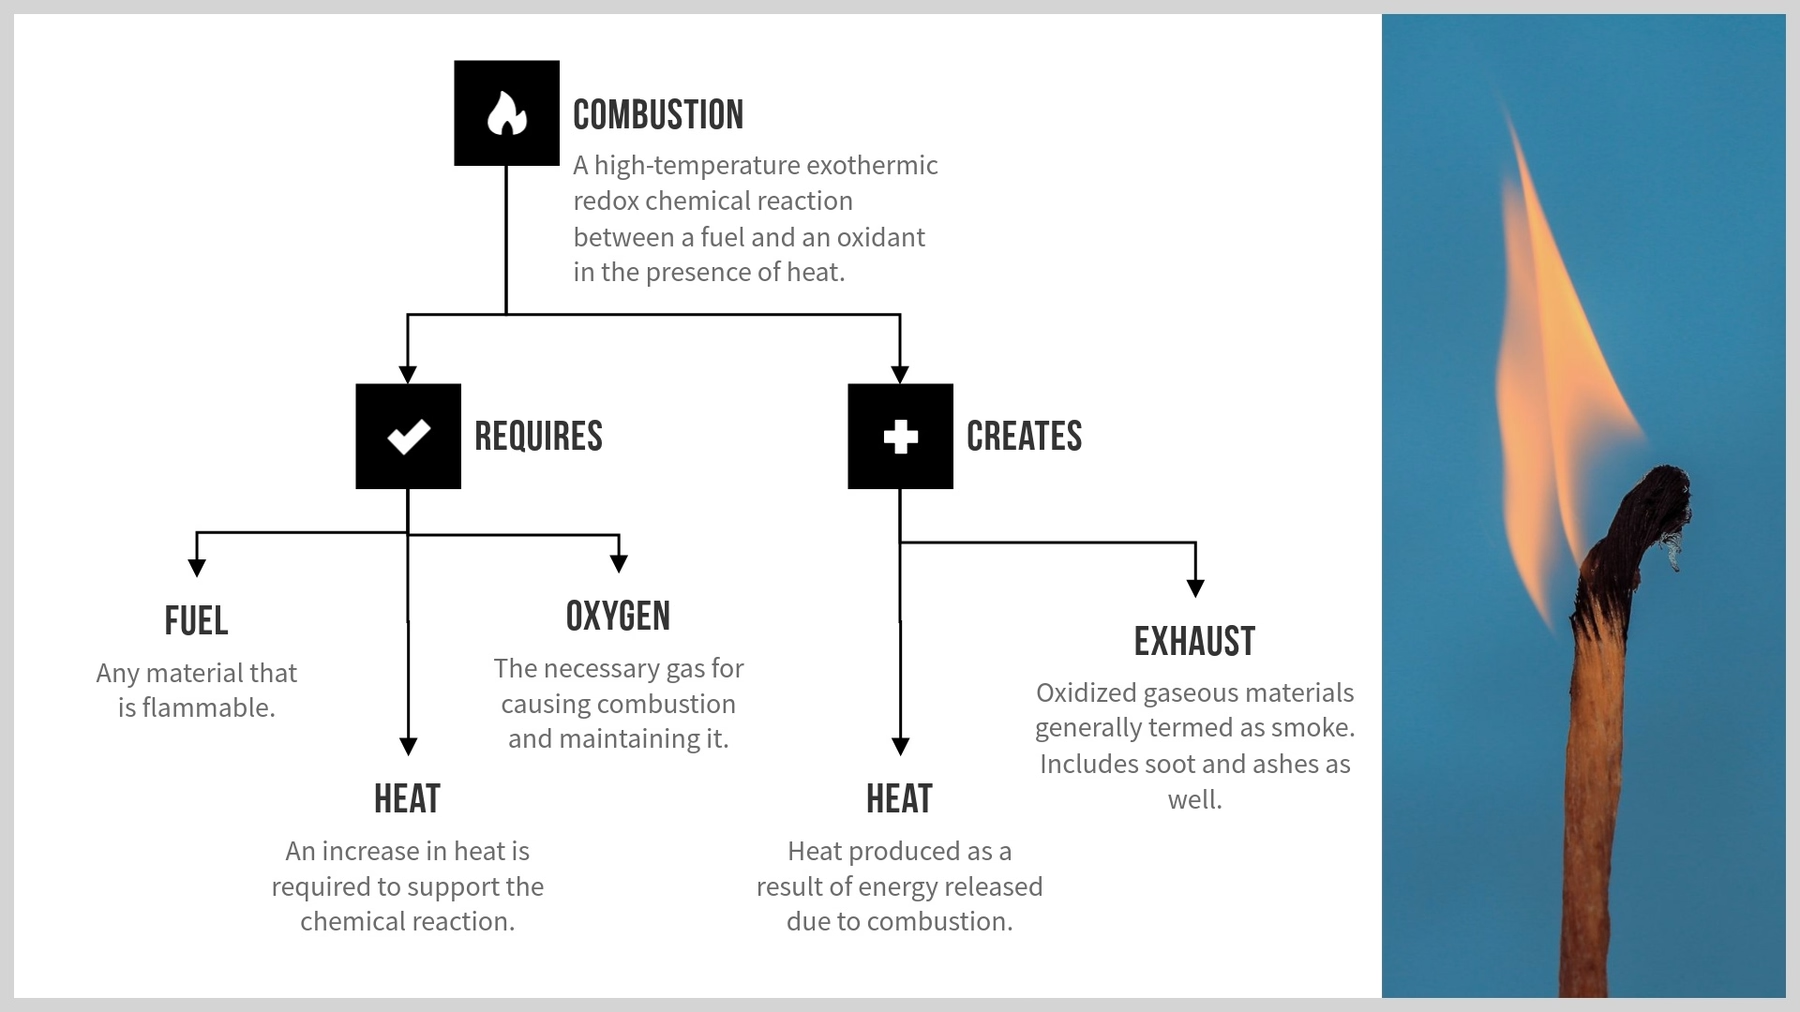
10. Flow Chart
A flowchart is a diagram that shows the sequence of steps and decisions needed to perform a process. Each step in the sequence is noted within a diagram shape. Steps are linked by connecting lines and directional arrows. This allows anyone to easily and logically follow the process from beginning to end.
Some of the use cases for flowcharts include process documentation, auditing a process for inefficiencies or malfunctions, or mapping algorithms.
Check out all of Beautiful.ai’s Smart Slide templates here, and let us know which one is your favorite.


.webp)
